Scoring sets - Standard and Monetary
Risk Scores, Inherent, Residual and Dynamic Residual and scoring sets standard and monetary. Risk Maps.
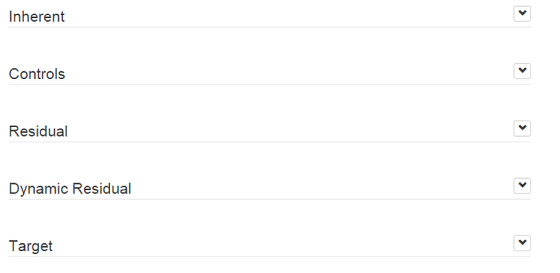
Inherent. The Gross risk score with no controls in place
Controls.The controls to mitigate or reduce the risk score
Residual. The Net Score after taking in to account the controls
Dynamic Residual (D.R). The net score based on the status of the controls (using assessments you can verify controls are working, if they fail this will automatically change the dynamic residual based on the control.
Target: The ideal score, where you would like to see the risk be.
Scoring Sets
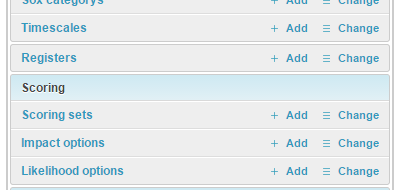
In the admin section under Risks you have Scoring sets. These allow you to use different types of scoring mechanisms. E.G. 5X5 standard scoring of impact and likelihood options valued 1 to 5. Or monetary scores to calculate financial loss. Scoring sets allow you to use different scoring for different types of risks. For instance you might want to have a standard set and 2 monetary sets, one for USD and another for GBP. You can have as many voting sets as you require.
Adding. Click the Add link.
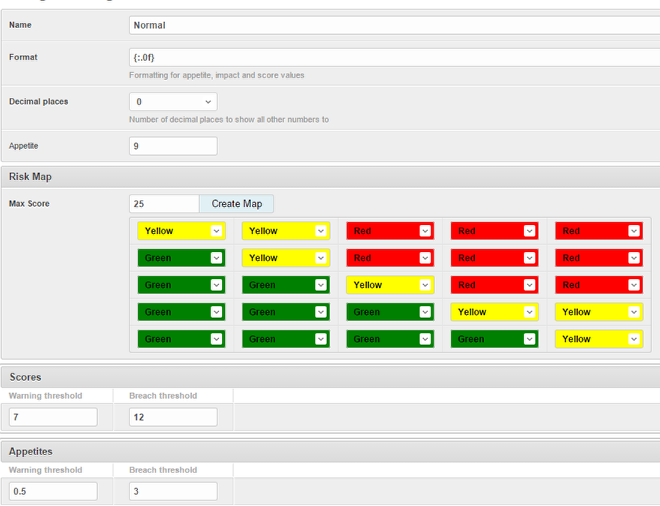
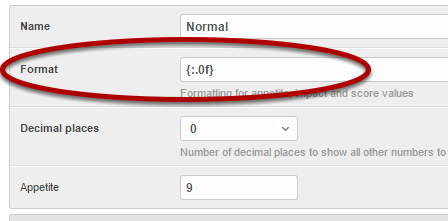
Name: This is what you want to call your voting set
Format: the format the score is displayed in {:.1f} is 1 decimal place {:.0f} is no decimal. ${:.2f} is a dollar in front and 2 decimal places. £{:.0f} would be a pound in front and no decimal place.
Appetite: where your acceptable value should be drawn. for instance a 5 by 5 score set has a maximum value of 25, so an appetite of 9 would indicate a mid range acceptance whilst an appetite of 15 would be towards taking risks.This line can be used to report on risks scores based on the distance from appetite. (Appetite can also be set at risk and category level. The voting set level is the fall through value, priority order is 1. Risk level, 2. category level, 3. Scoring set level.)
Risk Map: enter your max score value for your votes 3x3 is 9, 5x5 is 25. Max score 100 (10x10), each colour represents a square on the map, select if that square is Red,Amber or Green. This will create your risk map. Maps must have an equal number up and along (5x5)
Score thresholds. The scoring uses RAG (Red, Amber, Green) colour codes for the maps and risk registers. Green is below the warning threshold, Amber from Warning to Breach, above breach is Red. So on the above 6 would be green, 8 would be amber and 12 or over red.
Appetite thresholds. When using the distance from appetite reporting how much away from the appetite before green turns to Amber or Red. (Warning is Amber, Breach is Red) So on the above example if a score was more than .5 over the appetite it would be amber, more than 3 would be red.
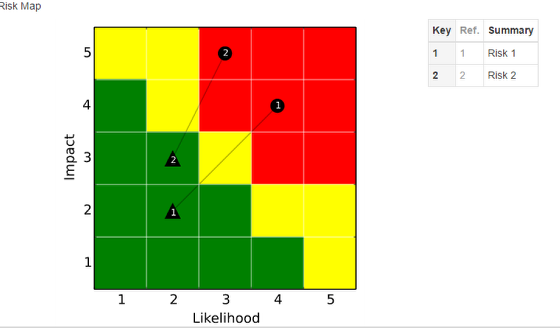
This is what the risk map of the above scoring set would look like. Note: maps must have an equal number along each axis.
Monetary
For monetary scoring sets set the currency symbol and how the currency should be format. E.G. ${:.2f} will add 2 decimal places. ${:.0f} will be no decimal places.
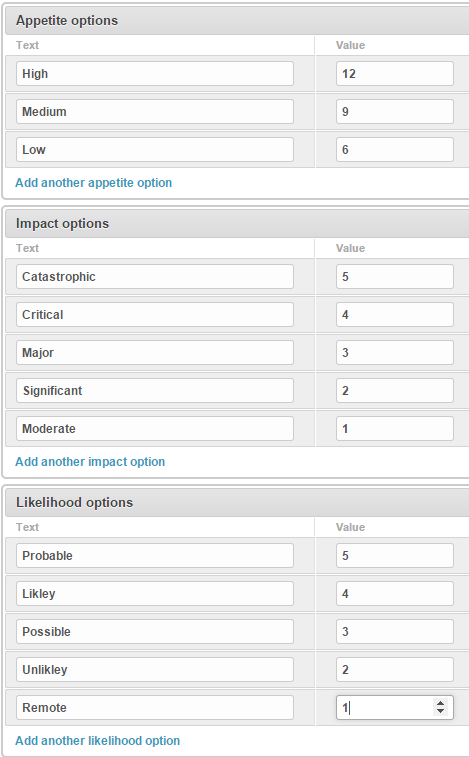
Under Appetite options enter the names and values for the drop downs. This allow users to set or use in voting a set choice that has a value.
Repeat this for Impact and Likelihood
Multiple Scoring Sets
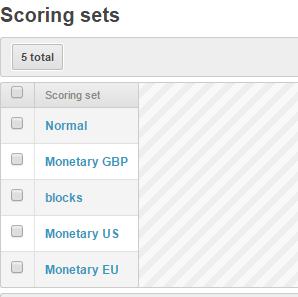
You can have as many different scoring sets as you require. This allows you to select different scoring sets for different types of risks.