Create a Risk Map Dashboard
How to use the risk map background in a dashboard.
The Risk Map Tile
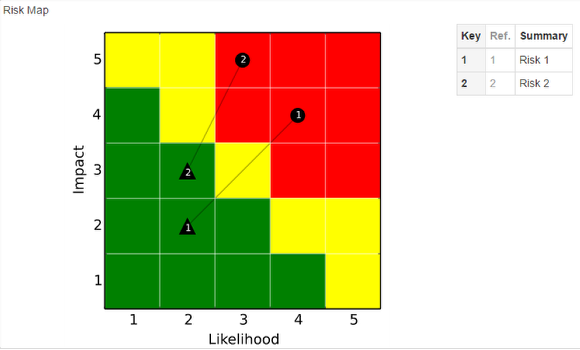
The below steps show you how to create a traditional risk map tile using the Risk Map matrix set up in the scoring set. See Scoring sets - Standard and Monetary
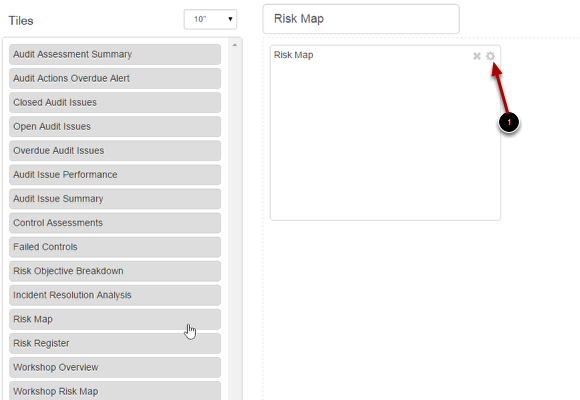
Drag the risk map tile across to the view area
You now need to customise the map, click on the COG icon (1) to configure the options

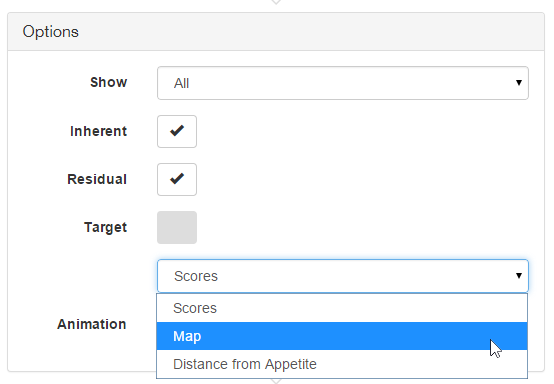
Change Scores to Map

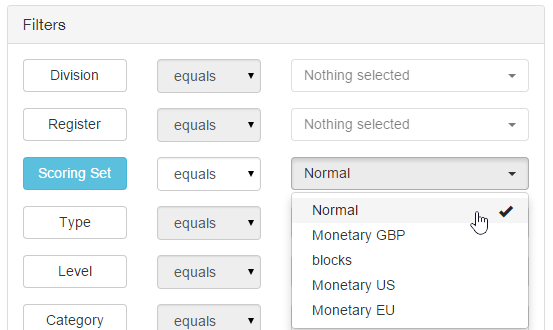
Under filters select a scoring set, which scoring set to report on. If you have multiple scoring sets you can set up further maps by repeating the steps above. A dashboard can have many times and tiles of the same kind.

Commit to save the options.

Click save to save the dashboard

